Automation Time Saved | Show Your Stakeholders the "Flow ROI" 💰
- Jeremy Steinbring
- Jul 26, 2023
- 4 min read


A New Flow is Born 💥
So, you've built a new Flow in Salesforce... and you should be super proud of yourself because:
a) It Works! (Easier said than done 👌)
b) You Followed Flow Best Practices 🤓
Including Fault Paths for DML Elements (Create, Update, Delete)
Adding Decision Elements after Get Record Elements
Adding descriptions for each element outlining what it does and why it's important to the overall process
c) You've Increased Your Team's Efficiency
(Or did you?...🤔)
Most admins and consultants I know 🛑 there. They've asked good discovery questions, they've designed a beautiful Flow, & it's live in production working as intended. But they're left with more questions than answers...
How do I measure the efficacy of what I've built?
How do I know if people are using this automation?
Have I saved the company time & money? If so, how much?
(Should my CFO be made aware of how vitally, irreplaceable I am to the organization and how they'll never find anyone like me again, no matter how hard they try, and crumble under the weight of sadness if I were to ever be "invited to leave"? 😉)
All great questions...
✅ Here's the "Automation Time Saved" Flow Solution I've designed to answer these questions & show stakeholders the Flow ROI 💰 in an easy-to-understand way. ✅
How To Position "Flow ROI" 💰
Like a classic Quentin Tarantino movie 🎥, I'm going to show you the finished result first and work backwards. Here's a sample Flow ROI dashboard I'd show a stakeholder or client: (Click the image to expand)

It includes some key dashboard components like:
Estimated $ Saved
Total Time Saved in Hours/Minutes
Time Saved by Flow
Time Saved by User
Time Saved Over Time (or as I've called it "The DiCaprio," Inception fans... you're welcome 🪑😴🪑😴🪑😴)
The 🔑 is using this data to tell a story. These are just numbers & graphs on a screen until you explain what they mean and why stakeholders should care. I like to position this as the "Flow ROI," which indicates how effective and useful the Flow automation you've built is. It all boils down to ⏰ & 💰, so visualizing how your creations have saved the company lots of it is paramount: a well-designed Salesforce dashboard is the best option for your presentation.
Ok, now the fun part... here's the step-by-step guide to build this solution in your own org! 🎉
The "Automation Time Saved" Flow Solution 💪🏻
1️⃣ Build the "Automation Time Saved" Custom Object
The first step is to create a way to capture a "time saved" value for every Flow Interview. The best way to do this within Salesforce is to add separate records to a custom object.
Start off by building a custom object called "Automation Time Saved" with the following values: (Click the image to expand)

Create a new "Tab" and add it the App you most frequently use for quick access.

Create the following Custom Fields (4) with the appropriate level of permissions for your org:
Flow Name: 💬 Text / Length = 255
Running User: 🔎 Lookup > User Object / Child Relationship Name = Automation_Saved_Time
Time Saved (Minutes): #️⃣ Number / Length = 16 / Decimal Places = 2
Estimated $ Saved: 💰 Currency Formula / Time Saved * Estimated $/minute

Estimated $ Saved Formula | Salesforce
Note: Estimate the amount of 💰 saved per 1 minute of User time. Ex: Average salary is $100,000 a year, which is $8,333 per month, $2,083 per week, $416 per day, $52 per hour, $1 per minute.
Helpful Salesforce Articles:
2️⃣ Time Saved Variable & Flow Adjustments
Now, let's build the proper Flow variables and elements to create Automation Time Saved records for your existing Flows.
Play the video below for an in-depth walkthrough... ⬇️
3️⃣ Visualize the Data with Reports & Dashboards
The last step is to build a report & dashboard to visualize the data. The goal here is to create a simple way for stakeholders to digest the information you're surfacing. Use language that is easy to understand (❌ Acronyms ❌), make it visually appealing, & organize it in a way that makes sense.
📣 We read top-to-bottom and left-to-right. Putting important metrics in the bottom right corner doesn't help your cause! 📣
Let's build a new report that we'll use as the source for our dashboard. Click the "Reports" tab at the top of the page and click "New Report" in the upper right-hand corner. Search for "Automation" in the All Category section and select "Automation Time Saved."

Add Columns, Group Rows, & Saved Time (Hours) Summary Formula as seen below while also updating the Report Filters to Show Me = "All Automation Time Saved" & Created Date = "All Time." (Click the image to expand)
Note: It's very important to summarize the report this way, so the correct options are available to you when building each dashboard component.


Click "Save & Run." Give your new report a Name, Report Description, & place it in a Report Folder that has at least "View Access." If you miss this step, no one will be able to view your report!
Now it's time to build your new shiny, new dashboard✨. You can build all 6 dashboard components using this 1 report 🤯!
Did you also know you can put emojis in your dashboard component titles? Where emojis can be added, emojis should be added: don't @ me...
💰 Estimated $ Saved:

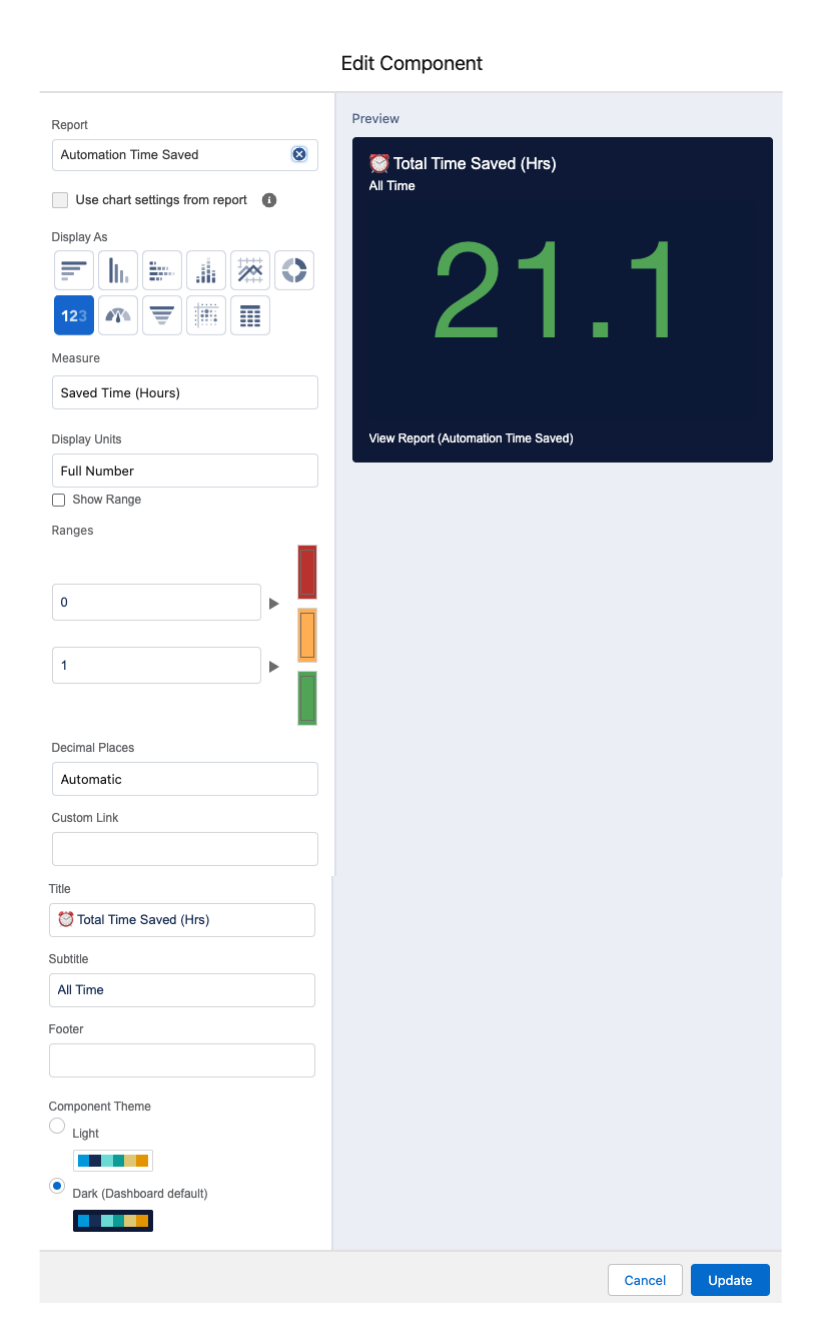
2. ⏰ Total Time Saved (Hrs)
3. ⏰ Total Time Saved (Minutes)

4. ⏰ Time Saved by Flow

5. 🗓️ Time Saved by Month & Flow

6. ⏰ Time Saved by User & Flow

Done... there you have it! I've used this solution countless times to show the value Flow automation can bring to your customers, and now you can too. 🎉
Need a Custom-Built Solution?
If you need an extra hand or want a custom-built alternative, schedule a free consultation today by clicking the button below.
---------------------------------------------------------------------------------------------------------------------------
I’m Jeremy Steinbring ☁️, Founder at RevOnyx. It’s a pleasure to meet you!
Did you like this? Maybe learned something new?
If you want more content like this, click my Name + Follow + 🔔

Comments